
This is the Way … to Analyze Changes in Brand Drug List Prices
Drug prices are quite a problem, aren’t they? At least this is what we are told. But wait … what are the prices of our drugs, and how do we get our grubby little hands on such information? Unfortunately, you can’t – at least not without shelling out thousands of dollars for access to drug pricing databases. So how can we conclude that drug pricing is a problem when we’re all operating with partial information? We can’t – which we would argue is an even larger problem. It’s like living on Alderaan in 0 BBY. A massive Death Star blew up your entire planet, but you had no idea what a Death Star even was. Ignorance was far from bliss when it came to galactic warfare in the days before we knew what the Empire was capable of.
So here we are in the same situation when it comes to drug prices. Well, not exactly the same. Many people generally believe we have a significant problem when it comes to U.S. drug prices. We are very aware of the existence of the dark side powers that are punishing plan sponsors and patients across the galaxy. But the general public’s understanding of the problem is very surface-level and often clouded, and they are unaware that their lack of comprehension is what enables the mind tricks used by those running the pharmaceutical enterprise (and by this term, we mean everyone who has a hand in drug development, distribution, and management) to maximize revenues and live the Canto Bight dream.
The good news is that cracks are starting to form in the walls of the black box that is U.S. drug prices, and people are starting to see inside to its rotten core. And while we may never obtain the complete Death Star plans, at 46brooklyn, we continue our work to piece together as much of the system as we can.
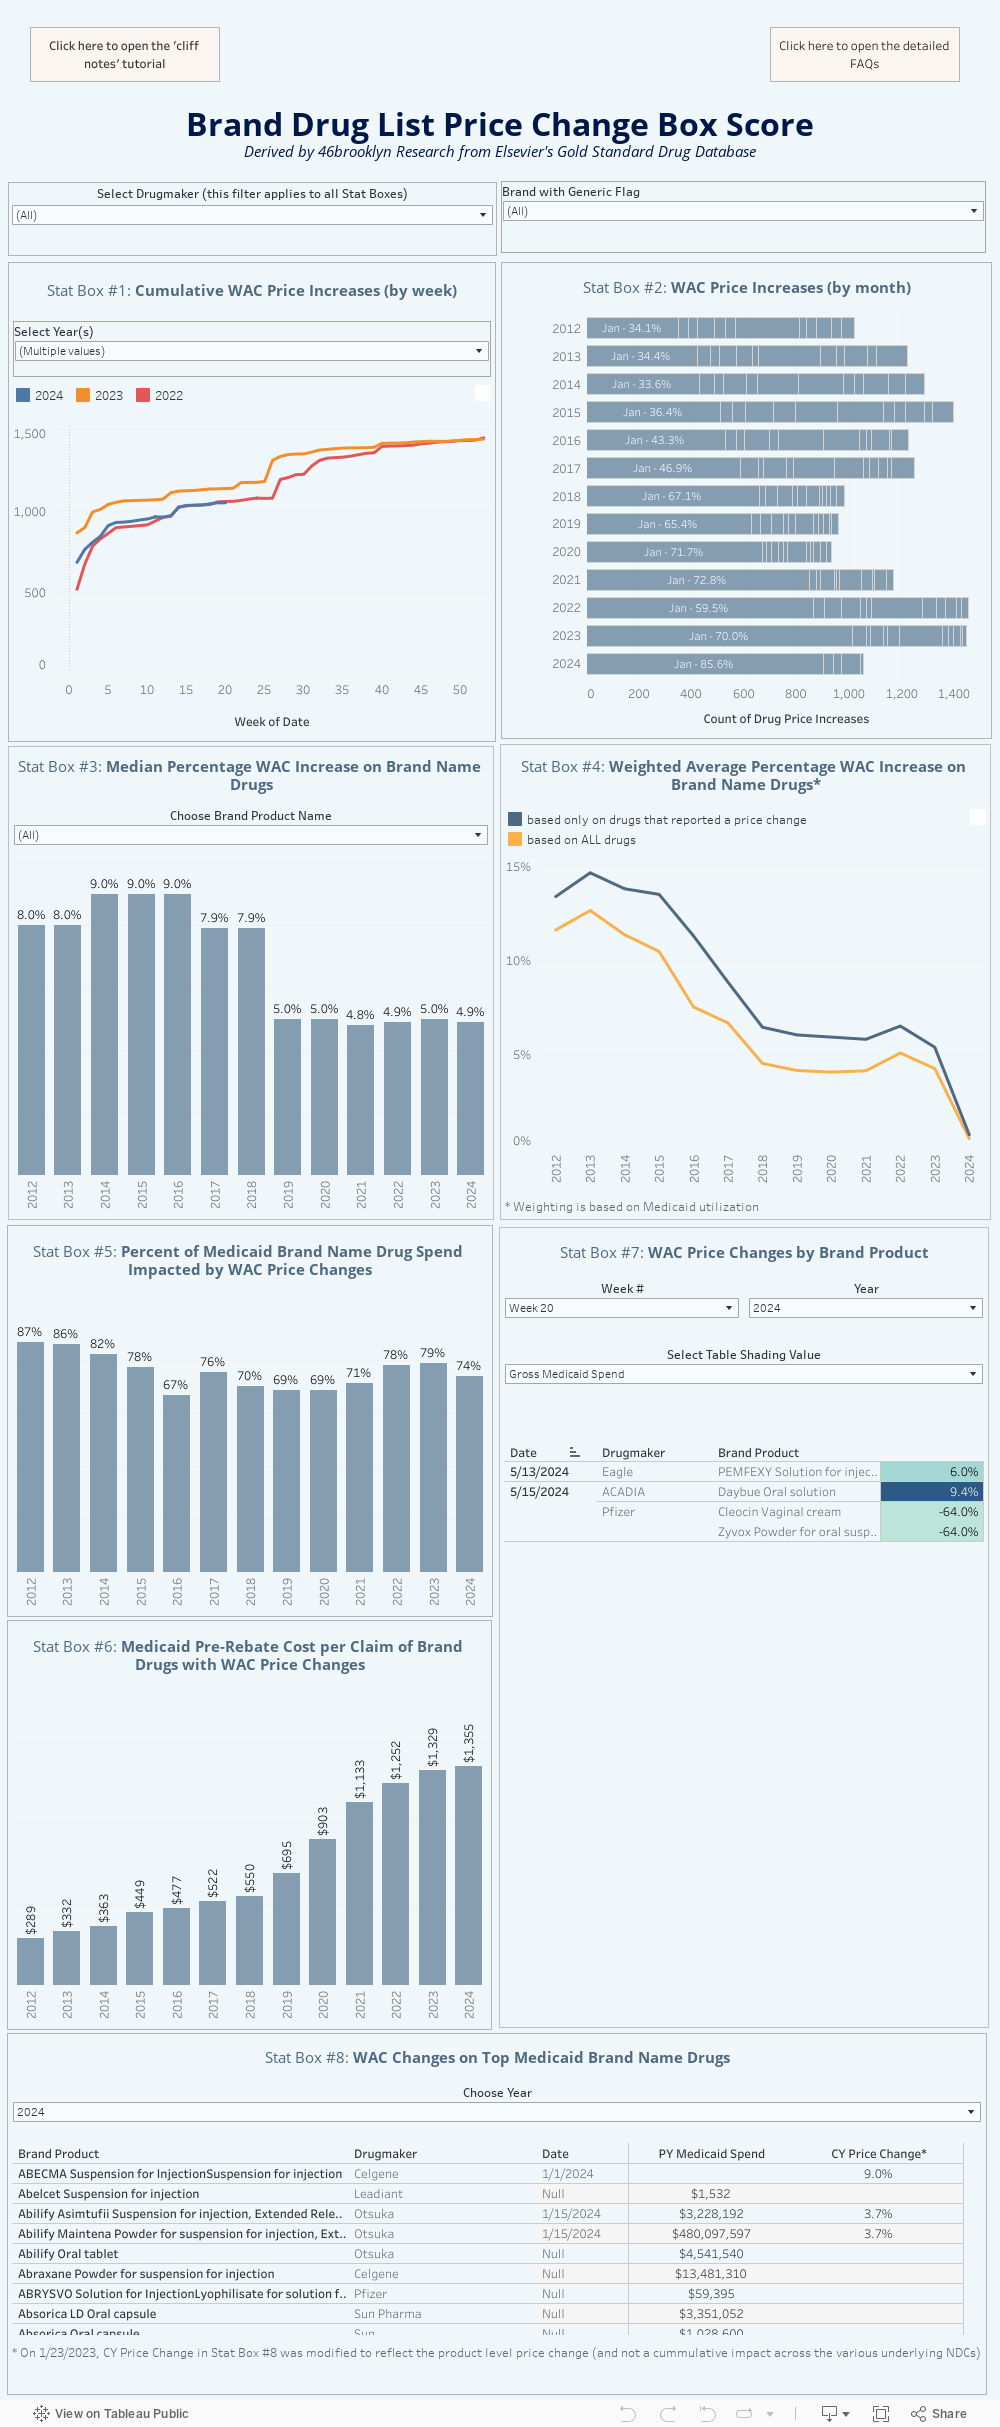
This Brand Drug List Price Change Box Score, which we originally launched years ago to provide the general public with changes in drugmaker Wholesale Acquisition Costs (WACs), is another 46brooklyn attempt to to zero in on the primary weakness within the ultimate power of our nation’s drug pricing universe. To be sure, this visualization does not completely break open the proverbial black box that is the U.S. drug pricing system. There are many layers and nuances of our system, and this is an important view of just one very important layer.
In this dashboard, we are not permitted to directly publish WAC prices. We can only publish changes. Also, this dashboard only shows changes in brand drug list prices. It doesn’t capture the variable, completely hidden, and ever-growing rebates shuffling around in the dark. But it’s a start. It is the first time we can all get on the same page about what is really happening with brand drug list prices.
So go ahead and dive into what is one of our most robust dashboards. See which drugmakers are increasing prices and by how much. Compare these price increases across the past decade. View them on a weighted basis, using Medicaid’s drug utilization trends. Size them across a drugmaker’s entire portfolio of drugs, rather than just the drugs with price changes. Filter the increases based on whether or not the brand drug has generic or biosimilar competition.
Put simply using the Mandalorian Creed, if you are trying to make sense out of brand drug list price changes … This is the way.
Data Sources
How we Created our Dataset
See our FAQs for detail on how we created the database that lives behind this visualization.
How to Use
If you’re looking for a quick tutorial on how to use the different “Stat Boxes” within the Box score, flip through the companion report to this visualization that we released in conjunction with dashboard in 2020. NOTE: We strongly suggest reading this short report before using the tool to proactively answer basic questions on its use.
If you’re instead looking for a deep dive into how the tool works (and its limitations) you’ll find that in the FAQs. If you have any questions that are not already answered in the FAQs please contact us and we’ll add your question to the living document.
Update Frequency
January: Every week (at a minimum)
February-December: Monthly
Please view this visualization on a laptop/desktop or tablet. It is not designed to be viewed on a smartphone, as it contains too much information to fit on the screen. If you must use on a phone, flip the phone landscape, and then scroll to see all of the content.
v 5.03 - released January 23, 2024 (data as of 3/1/2024)
For full release notes click here